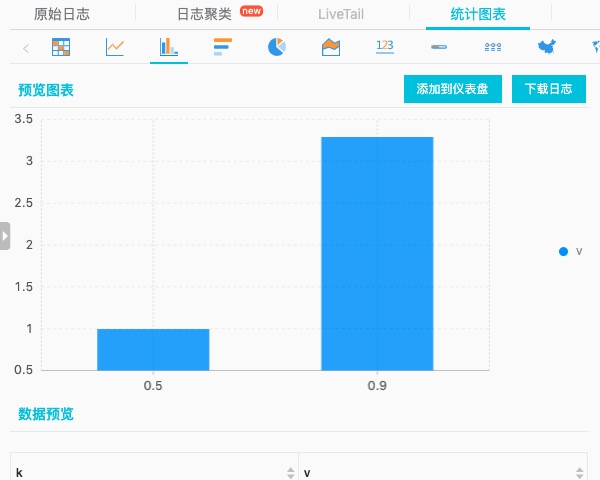
Estimate the values for percentiles 0.5 and 0.9
Use the approx_percentile function to obtain the values corresponding to 0.5 and 0.9. The results are displayed in a column chart, in which the custom percentiles [0.5,0.9] are displayed in the x-axis and the return values are displayed in the y-axis.
SQL
* |
select
  k,
  v
from(
    select
      map(array [0.5,0.9], p) as m
    from(
        select
          approx_percentile(upstream_response_time, array [0.5,0.9]) as p
        from
          log
      )
  ),
  unnest(m) as t(k, v)
SQLSample query result: